Percentage Luck in Hockey, Explained
Visualizing what PDO and on-ice shooting actually mean, and why we should pay attention to them.
One of the oldest topics in hockey analytics is “puck luck.” Hockey has been repeatedly shown to be the most random of the major North American team sports, in large part because it’s based around a three-inch piece of rubber ricocheting around an ice rink at up to 110 miles an hour. To try to filter through all this noise and identify which teams and players are the beneficiaries of this madness, analysts have developed ways of identifying which numbers are sustainable and which ones aren’t. Most stats-savvy fans are well aware of these methods, since they’ve been around for over a decade. But for those who weren’t exactly deeply engaged with the analytical debates of the early 2010s, seeing their favourite team’s results dismissed as “unsustainable” tends to sting a little bit. As I’ve posted player cards all offseason on my Twitter account, I have tried to note when I believe a guy’s results have been inflated or deflated by percentage luck (such as Dominik Kahun, Jared McCann, or Ryan Graves). This frequently draws a lot of heat from fans who think I’m selling those players short.
With that in mind, I thought it might be worth digging into these topics again using the past ten years of data, not only explaining these concepts but visualizing them as well. Understanding the concepts of “sustainability” and learning to recognize outlier percentages helps make you a smarter hockey fan and better understand stats from goals and points to Wins Above Replacement. I’ll be looking at this topic at the team level, the individual shooting % level, and the individual on-ice shooting % level. The stats in this piece come from NaturalStatTrick.com.
Team-Level Percentage Luck
A Reminder of What PDO Is
PDO (which doesn’t actually stand for anything) is a simple stat calculated by adding up on-ice save percentage and on-ice shooting percentage. There are two basic principles behind it:
Both save percentage and shooting percentage are vulnerable to randomness and luck, as both have weak repeatability from one year to another.
In the whole league, the percentage of shots that go in + the percentage of shots that are saved add up to 100% (it just makes sense).
For over a decade, the stats community has used PDO as a short-hand proxy for a team’s puck luck. But that doesn’t mean it’s totally perfect. By visualizing its repeatability, you can see both why it’s very useful but also why it’s somewhat flawed.
The way we’ll repeatability is to compare “Year 1” with “Year 2”; these are pairs of consecutive seasons. An example could be Year 1 = Pittsburgh’s 2012-13 season and Year 2 = Pittsburgh’s 2013-14 season. By taking the whole data set and observing the relationship between PDO in Year 1 and Year 2, we can see how much it’s random and also how much it’s influenced by actual talent.
We’re going to plot those years on a graph where
The blue dots show every PDO a team has put up in the past ten years, sorted from highest to lowest. (Year 1)
The red dots show the PDO that the same team put up the next season. (Year 2)
Notice how it’s almost completely random:
Note I said almost. If you look at the red trendline you’ll notice it tilts slightly downwards. That’s because there are elements of PDO that aren’t caused by luck, like shooting talent and goaltending. For example, the Tampa Bay Lightning have had a PDO above 100 in eight of the past ten seasons, and have exceeded 101.7 in each of the past three campaigns. Meanwhile, the poor Senators have not exceeded 99.7 since 2016. Some teams are just better at scoring and stopping pucks than others. But these are extreme examples, and overall repeatability of PDO is still extremely low.
That goes for its components too. Here’s the same graph, but only using shooting percentage:
And save percentage:
For all of its flaws, raw PDO remains the best proxy for luck that we have, and there are plenty of cases where it has been applied very usefully.
The top five teams experienced what stats people sometimes call “PDO benders,” where they scored and won games at a rate wildly out of whack with their shot share (SF%). For example, the 2015-16 Panthers shocked the hockey world by winning the Atlantic division. They scored 56% of the goals at 5v5 and won 47 games despite being about even in terms of shots, in large part because of an inflated 102.1 PDO. The next season, despite only playing slightly worse, their percentages regressed and then some, leaving them below .500 and costing Gerard Gallant his job. PDO told us that they were not as good a team as they seemed in 2015-16, and not as bad as they seemed in 2016-17. The bottom four teams prove that the same can be true in reverse; the 2014-15 Coyotes had abysmal percentage luck and rode it all the way to a third overall pick. The next season they were actually worse in terms of shot share, but because their PDO regressed upwards they finished just below .500.
The traditional line with PDO is that it will “regress to the mean”, i.e. 100. But as we saw above, there is a skill component involved, even if it is slight. Based on the trendlines above, I calculated using a simple linear regression what an “expected” year two percentage performance might look like for each team-level save percentage, shooting percentage, and PDO:
As seen above, all three of these stats are mostly random, but the talent effect does mean that teams that reach certain numbers are expected to do a little better in the next year. So for example, the Minnesota Wild (who shot 9.4% in 2019-20) are projected to regress to 8.2% in 2020-21. Their 91.5% save percentage would be expected to improve slightly to 92.1%, leading their 101 PDO to regress to approximately 100.2.
We don’t only use PDO to predict regressions from one season to another. Teams go on small PDO benders during the regular season, and those often lead people to get unrealistic ideas about how good their favourite team is - or even lose coaches their jobs. Here’s the same calculation from above, but instead of comparing Year 1 and Year 2 it compares a team’s December 31st PDO to where it’s settled by the end of the season. It still regresses to the mean, but a bit more softly (since there’s ~41 rather than 82 games to do it).
To conclude, the notion that full-season team percentage results are absolutely based on talent and not luck is untrue. While shooting and goalie skill are a small component of what drives team shooting % and save %, they are hugely outweighed by randomness. As we’re going to see, that goes for skaters as well, whether it’s their own shooting or on-ice shooting.
Player-Level Individual Shooting Luck
There’s little more exciting in hockey than when a guy suddenly starts piling up goals at a ridiculous rate - obviously it just means that he’s finally broken out, and fans around the league had better take notice! Time to add Mika Zibanejad to the top ten centres lists. But when those goal totals are reflective of a hugely inflated shooting percentage, well, maybe we should pump the brakes slightly.
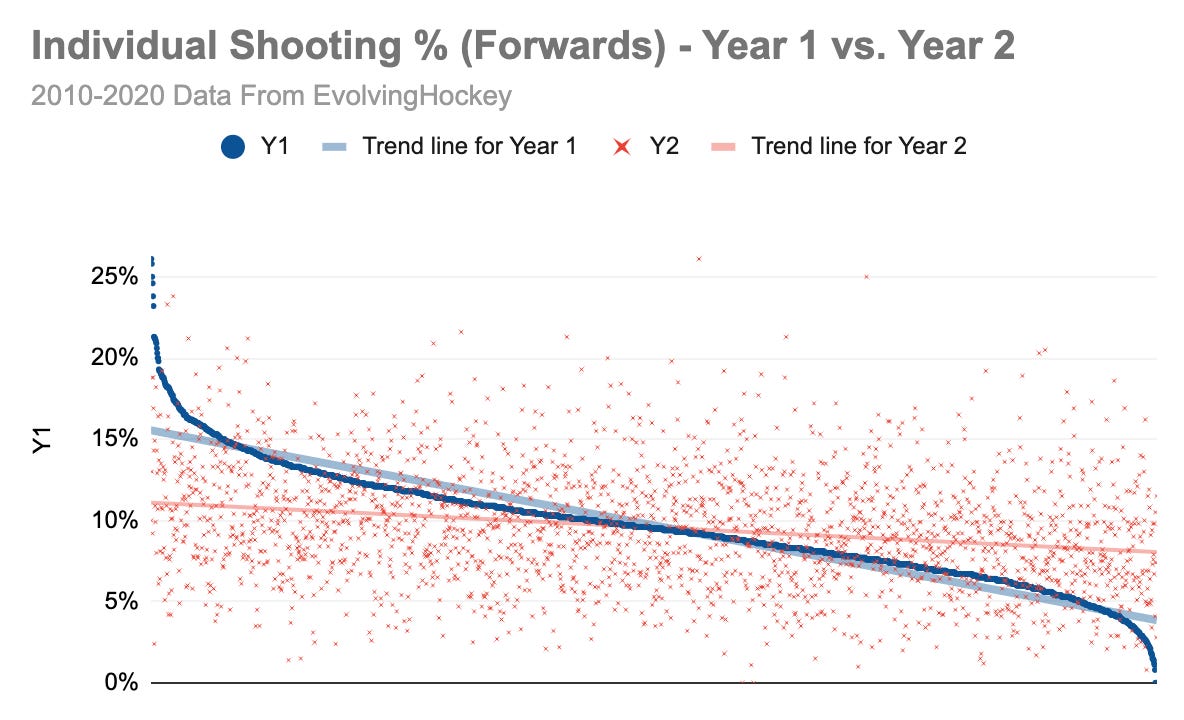
I’ve chosen to use a similar chart to the team ones, showing all 2000+ pairs of seasons from the past ten years. I’ve decided to filter out defencemen, since blueliner goalscoring isn’t typically a topic of conversation:
Here’s the same data but broken down in terms of how often in the past ten seasons a player has surpassed a certain 5v5 shooting percentage and then also done it the next season. What’s evident is that even if you put up an insane shooting performance, you’re probably not going to run it back again.
Let’s take a quick break from the graphs and use the good ol’ eye test real quick. Dominik Kahun shot 13.8% this season, scoring 12 goals on 6.7 expected goals. Based on the data, this is probably not sustainable. Watch those goals and you can see why:
Kahun is a skilled player, and a number of these goals come off great shots or happen because he made a smart decision to get in the right place. But there are also a good number that could be fairly called “low percentage” as well as a few that are taken on a fortunately empty net. More to the point, it is very possible to envision a universe where about half of these shots don’t end up going in.
Now back to the numbers (sorry).
Here are the 37 players who shot at 15% or above last season at 5v5:
Based on past data, we can expect that only around four of these players will appear on this list next season. Some one-year wonders are pretty obvious (sorry Freddy Gauthier), but there’s a lot of talent on here that will see a regression too.
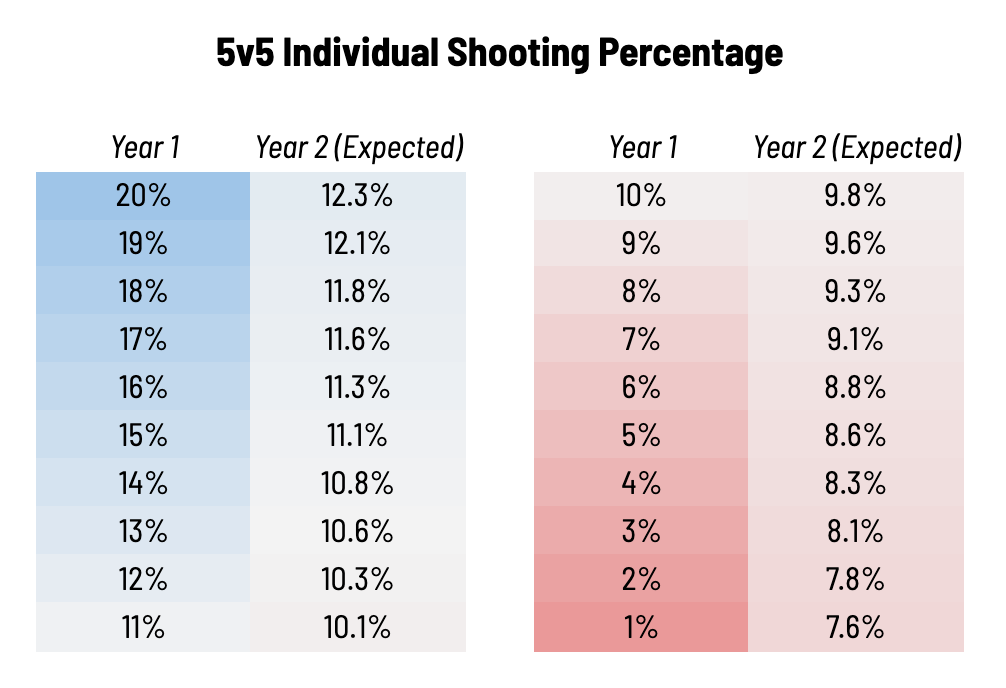
Using the same type of linear regression as above, we can make a similar “prediction” about how players will regress based on their Year 1 shooting percentage using the past ten years of data.
So that 15.5% 5v5 shooting percentage that has everyone so jazzed about Mika Zibanejad as a top ten centre? Based on past data a safe guess would be around 11.2% next season, which would still be an improvement on his results in the prior three seasons. Meanwhile Joe Pavelski, who went from 38 goals to 14 last season while shooting 5.9%, should see some upward regression; the model projects him back around 8.8%.
So even individual shooting, something that a player theoretically has control over, is subject to a huge amount of randomness even over the course of a full season. "Not getting the bounces” is real, folks.
Player-Level On-Ice Shooting Luck
If players’ control over their own shooting percentage is tenuous, their ability to actually exert control over the shooting ability of their linemates is even sketchier. On-ice shooting percentage (oiSh%) luck can have huge impacts on a player’s stats, including their goals, their assists, their points, their plus-minus, and even their Wins Above Replacement (which uses impact on on-ice goals for as a primary input). Ryan Graves led the NHL in +/- this season, and a major reason for that is that he had a 11.2% oiSh% (not to mention a 93.7% on-ice save percentage). Bryan Rust, who shocked the hockey world by scoring at a 40-goal, 84-point pace this season, was powered by a 12.2% oiSh%, which was the third highest in the league behind Brayden Point and Artemi Panarin.
Many Edmonton Oilers fans took issue when I pointed out that their new free agency aquisition Dominik Kahun had many of his numbers inflated by on-ice shooting percentages that I considered to be extremely unsustainable. His 5v5 on-ice shoooting percentage (oiSh%) was 11.1%, making his season one of 138 in the past ten years to surpass the 11% mark. Fans argued that this was representative of what he was capable of, and he would likely repeat a similar performance next season. But the past ten years of data tell a different story.
Of those 138 skaters, only five had a similarly high oiSh% the next season. That’s 3.6%. If you lower the floor to 10%, only 15.1% of those skaters repeated the result. Even if you lower it all the way to 9%, that number only improves to 26.5%. So while it’s not impossible, the probability of Kahun or a player with similar results nearing, let alone sustaining, high on-ice shooting is quite low.
Here’s a list of players who had an oiSh% above 11% this season.
Based on past data, we can expect only about one of these players to be on this list next season - this year the one holdover was Evgeny Kuznetsov.
Let’s return to that swarm-looking graph from before:
As usual, a little bit of skill mixed in with plenty of luck. Very few players actually exert much control over the finishing ability of their linemates through passing, and few are fortunate enough to play with elite shooters consistently.
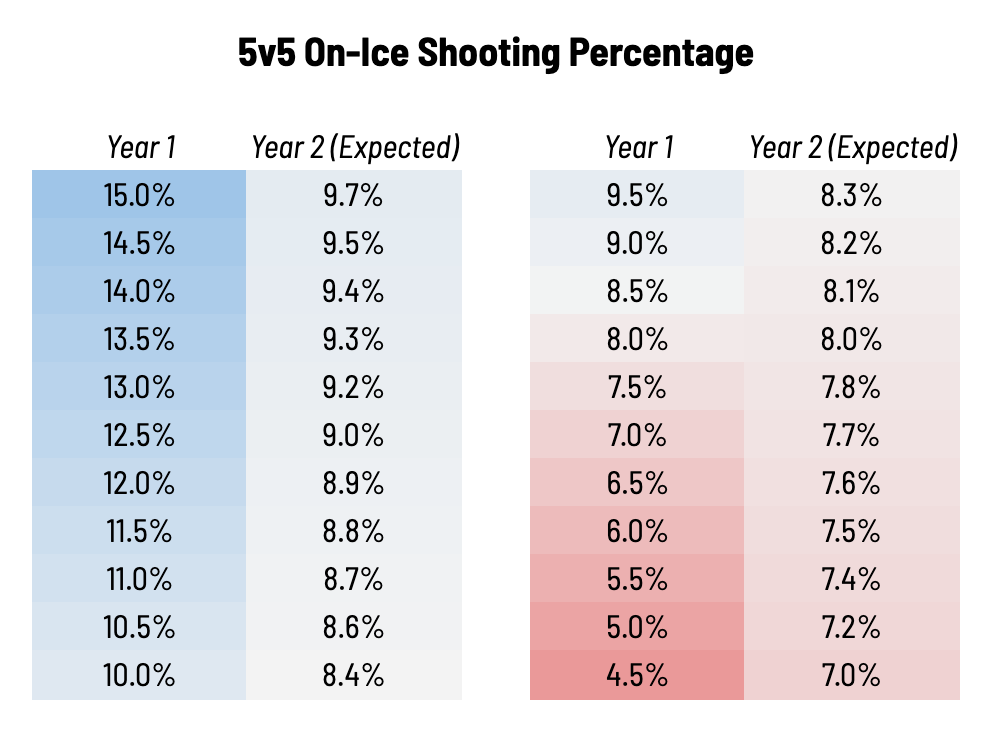
Finally, we can once again use linear regression to estimate year 2 oiSh%. So based on past data, it seems likely that Kahun’s oiSh% will regress from 11.1% to somewhere near 8.8%, which is a small improvement on his 8.4% figure from his rookie season. Meanwhile, poor Mark Jankowski and his 4.6% which stuck him with a league minimum deal in free agency should make up a solid amount of ground next year.
Conclusion
The story of percentage luck in the NHL is a cautionary one. Setting your expectations for a team or player based on sudden, unexpected stretches of apparent brilliance will likely leave you disappointed. Demanding a coach be fired or a player be traded because pucks just aren’t going in is likely a losing proposition.
Sometimes, the bounces really just don’t go your way. Even the most seasoned eye responds to pucks going in (and not going in) more than anything else, and we should be careful not to overreact to outcomes that are evidently unsustainable. When a coach, after his team dramatically outchances an opponent but can’t beat their goalie, says “we liked our process but we just didn’t get the bounces” it is not always just a lame excuse. When the Toronto Maple Leafs lost to the Blue Jackets in the Qualifying Round this season, they shot 2% at 5v5, the lowest five-game playoff total since these stats have been recorded. Should we make fun of the Leafs for that? Yes, because it’s fun. But should Leafs fans demand the team be blown up because of it? No.
Understanding how to recognize the randomness of hockey is a huge step towards understanding how the game works, how results come to be, and how they might look in the future. Keeping your eye on percentages will make you a smarter fan, a better fantasy hockey drafter (don’t take Bryan Rust in the first round), and most importantly, save you from looking stupid when the guy whose jersey you just bought goes back to scoring 15 goals a year.


"Should we make fun of the Leafs for that? Yes, because it’s fun."
As always, this is a correct take.
Great analysis.
As you say, these are nice tools to use for Fantasy Hockey.
Rust is the obvious fade. Killorn and Kubalik are 2 others whose draft slots will probably exceed their projected production.