Which Teams are Relying Most on Defencemen to Generate Offence?
Analyzing individual and team-level defencemen shot, scoring chance, and transition stats
One relatively obscure stat that always interests me is shooting shares - who on the ice is taking the shots? These can be useful at the individual and team levels, revealing how certain teams and players generate shots and scoring chances and who the “centres of gravity” are. For example, it’s difficult to understand how Dougie Hamilton creates offence without knowing that he’s a volume shooter, sending pucks towards the goal which contribute to chances and extended possession. This principle can be used to break down line combinations, players, and even teams, and something I get curious about is how often teams rely on their defencemen offensively. There are a lot of ways to assess this, some of which are pretty sophisticated - see Corey Sznajder’s article on the role of blueliners in Colorado’s transition game. But a straightforward one I like is to see quite simply how much of team’s offensive plays - shots, scoring chances, and transition plays - come from defencemen. These numbers aren’t available anywhere, probably because the interest in them is pretty limited (to, uh, me), but they’re easy to assemble and in my opinion worth checking out. So I took a look at how all 31 teams rank in terms of how much they rely on their blueliners’ contributions, for better or for worse.
A necessary qualifier is that it is not necessarily good or bad to have an offence driven by defencemen, and there are contenders and rebuilders at both ends of all of these metrics. As much as we might desire stats where ranking at the top or bottom is a definitive measure of quality, there’s also value in ones that serve as more of a guidepost for understanding the process that underpins those types of results. So while I know we’ve been conditioned to see blue=good, red=bad, that’s not always the case here.
So we’re going to break things down three different ways. First, we’ll look at which teams generate the highest share of their shots and scoring chances from defencemen. Then we’ll see which individual defencemen are driving these stats, as well as which ones take the highest- and lowest-quality shots. Finally, using Corey’s own transition data, we’ll see which teams rely the most and the least on their blueliners to move the puck up the ice, out of their own zone and into the offensive zone.
Team-Level Defenceman Shot and Scoring Chance Shares
Let’s start with the simplest one: which teams have the highest percentage of their 5v5 unblocked shot attempts (a.k.a. Fenwick) taken by blueliners?
Very interesting spread here. It’s no surprise to see the Knights and Hurricanes near the top of the list, and there has of course been plenty of talk about the eagerness with which certain Edmonton defencemen shoot the puck from the point. But Tampa being the clear number one wasn’t necessarily what I expected. It’s also interesting to see the Leafs right there at the bottom, amidst some of the more offensively dysfunctional teams in the league.
Let’s add shot quality into the mix. Which teams’ defencemen are getting the highest share of quality chances?
Some very telling teams rising and falling here. The Jackets vault up to the top of the list as the result of some very adventurous defencemen while the Jets, Flames, Canadiens, and Canucks all tumble down the ranking very far.
Out of curiosity, I decided to plot these two stats against one another to get a look at the quality that teams’ defencemen are generating relative to the quantity:
Once again, the Toronto Maple Leafs decidedly do not have their defencemen take a lot of shots or scoring chances while the Lightning are polar opposites. Meanwhile the Habs, Flames, and Jets especially generate a lot of shots from the point but rarely see their blueliners venture closer to the net. This is also on display when we look at the average expected goal value of defencemen shot attempts, where there are four Canadian teams in the bottom five:
Vegas, Columbus, St. Louis, Minnesota, and the Rangers seem to have the most ambitious defencemen. But how are these chances translating into actual defenceman goals?
Another interesting mix here. A quarter of the Dallas Stars’ 5v5 goals come from defencemen, probably another sign of that team’s deep offensive problems. At the other end, the Leafs get what they pay for: their defencemen don’t take a lot of shots, and as a result, 95% of their goals are scored by forwards.
Player-Level Defenceman Shot and Scoring Chance Stats
Let’s shift focus to individual players - who’s driving these results? I looked at the 170 defencemen with over 150 on-ice shots to find out.
There’s an unlikely name running away with the Mr. Blast it From the Point 2021 trophy…
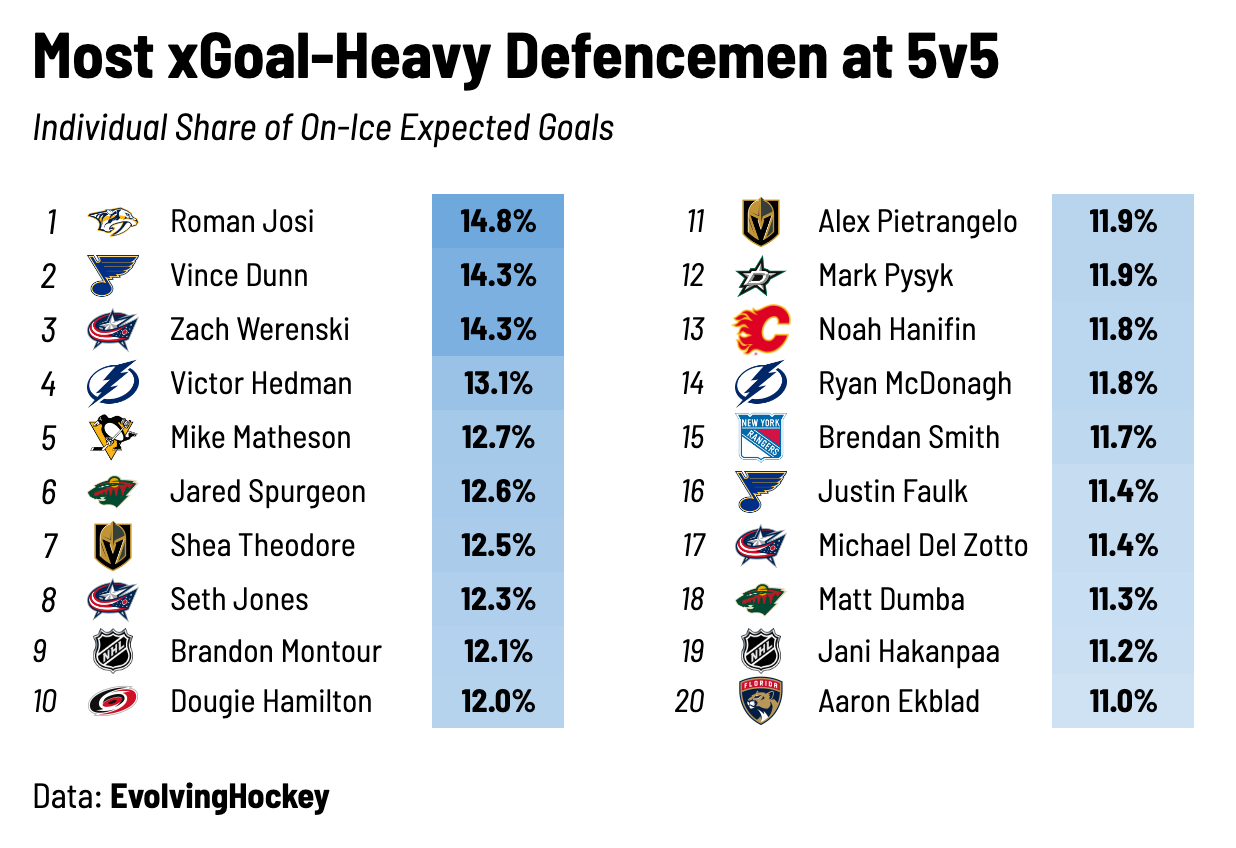
And here we get to solve the mystery of “why are the Jackets, Blues, Lightning, and Knights getting so many xGoals from their defencemen?”:
No surprise that Zach Werenski and Seth Jones are driving the bus offensively, although based on their results that might not be the optimal strategy to generate scoring chances and goals. The two Vegas stars are doing plenty of work, as are Hedman and McDonagh for Tampa Bay. Meanwhile Vince Dunn ranks surprisingly high on here as well, and Penguins fans won’t be surprised to see that the Mike Matheson roller-coaster includes a lot of individual scoring chances.
This did make me wonder which blueliners are getting the most bang for their buck when it comes to taking the highest-quality shots.
Alex Martinez of the Knights runs away here; I imagine that playing with Shea Theodore encourages a bit of restraint on his part. There are other names I’m not surprised to see, like Adam Fox and Jamie Oleksiak, who carry the puck into the zone frequently and have a knack for getting into dangerous areas. Ryan McDonagh is the least quantity-heavy defenceman on the Lightning, so he seems to pick his spots carefully.
But how about the flip side? Which blueliners are chucking the lowest-percentage shots towards the net?
Yikes. Three Jets at the top, including our good friend Logan Stanley. It is not ideal to rank 1st by far in personal shot attempt share and near the bottom in terms of the quality of those shots. Patience is a virtue. Other predictable names here include Ben Chiarot and Shea Weber of the Canadiens and Nikita Zaitsev, Mike Reilly, and Erik Gudbranson of (or formerly of) the Senators - can someone tell these Canadian teams that forwards are allowed to shoot the puck?
Team-Level Defenceman Transition Involvement
Finally, let’s move on to the transition game. Readers of this Substack know that friend of the newsletter Corey Sznajder tirelessly tracks an enormous suite of microstats that reveal valuable information about the way players and teams generate their results. So I decided to apply the same principle to his transition numbers, specifically focusing on how active defencemen were in terms of contributing to their team’s controlled zone exits and entries.
Let’s start with exiting the zone with possession of the puck. Despite the emphasis placed on defencemen who can make the “first pass” out of the zone, 61% of the time it’s forwards who ultimately carry the puck across the defensive blueline. But there’s a pretty big difference between the teams whose defencemen cross the blueline with possession (either carrying or passing the puck) and those whose forwards do almost all the work:
We’ve already seen the Stars lean heavily on their blueliners for goals, and it’s clear that they have major responsibilities in transition as well. Miro Heiskanen and John Klingberg rank 4th and 5th in possession exits per 60 among defencemen, the biggest driver here. Some teams near the top are boosted by a few extremely active players, like the Sharks (Karlsson), Panthers (Weegar), and Canucks (Hughes, who ranks 1st by far, and Edler); while others spread the wealth around.
All the way at the other end we have the Winnipeg Jets, who, as also-friend-of-the-newsletter Jack Han wrote about in February, don’t let their defencemen do anything (except take point shots, evidently).
So how about the other side of the transition game, entering the offensive zone with possession? I’ve expressed skepticism in the past with the idea that having defencemen lead the rush is necessarily a good thing for reasons that Corey himself summed up quite well in the linked McKeen’s piece:
You could argue it’s better to have your D involved [as a trailer rather than leading the rush] because the whole point of having them involved is to create a numerical advantage at the line or in the offensive zone. If the defender is leading the rush, usually a forward has to stay back or stationary at the line to cover.
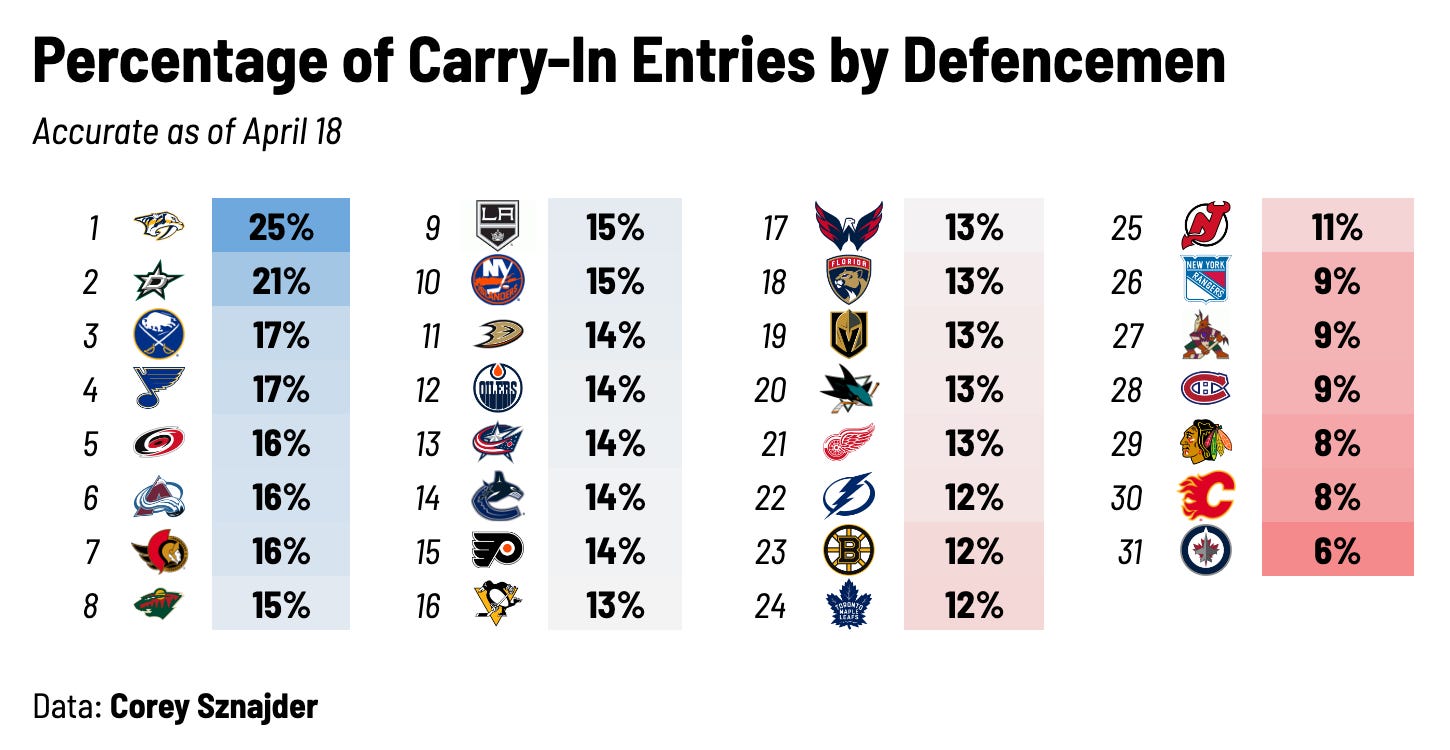
That being said, I was curious to see how teams stacked up in this area. And maybe I shouldn’t have been surprised:
Number one on the list - by far - is Nashville. That’s because of a guy named Roman Josi, who ranks first in the league among defencemen in carry-ins with 13.1 per 60 minutes. That’s almost double the rate of second-place Miro Heiskanen, who combines with 10th-ranked John Klingberg once again to put the Stars in second.
Once again, the Flames, Canadiens, and especially Jets feature at the bottom. 94% of Winnipeg’s controlled zone entries are done by forwards, and every Jets blueliner ranks below-average among defencemen in that category.
Here’s a similar scatter-plot comparing teams in both of these areas:
Conclusion
There’s a lot to process in this data, and it doesn’t necessarily point to easy answers. It’s not objectively a good thing to have your defencemen fire so many of your shots from the point, but it seems to be working fine for the Tampa Bay Lightning and Vegas Golden Knights. While you might not want Logan Stanley or Travis Hamonic taking a third of your shots on goal, no one’s complaining about Victor Hedman and Shea Theodore doing the same. And having an active D corps in transition can be great, like in Colorado or Carolina, but the Sabres and Predators aren’t exactly lighting the league on fire. Like many microstats, this data clarifies the “how” of results more than the “what;” it might quantify something that bothers you about your favourite team, reflect what you see on the ice, or reveal something valuable that you hadn’t been quite able to put your finger on. Considering how teams, lines, and players distribute their actions is a promising way of squeezing more value out of the limited data available to us, and I hope that it will prove useful.


This article is ignoring a super important point.
Focusing too much on offense from the defence, results in the goalie having to do more recovery work. This is why the Jets' goalies (not just Helle) usually succeed against oppositions.