


Breaking Down Elias Pettersson's Absurd On-Ice Shooting %
#40's puck luck improbably won't stop rising, but how sustainable is it?

There have been so many exciting narratives so far this season: the rise of the Canadiens, Connor McDavid’s hunt for 100 points in 56 games, the Dubois saga, and so many more. With so many games per night (and only about 95% of them starting at the exact same time), hockey fans have been spoiled this season. There’s just so much interesting stuff to follow right now.
But like any good stats nerd, my brain has decided to fixate on one extremely niche stat in particular: Elias Pettersson’s on-ice shooting percentage. I’ve found the parallel between this stat and the Gamestonk Wall Street drama to be pretty funny, because like Gamestop stock on early this week, this number has continued to rocket well past what analysts like me would consider “sustainable.” My continued fixation with this anomaly was cruelly mocked by former friend of the newsletter Dylan Griffing in an annoyingly viral tweet:


I have said for a while that on-ice shooting percentage is one of the most important stats that a hockey fan who wants to get smarter about the sport should understand. Even if you’re not interested in WAR or RAPM or any of those real “fancy stats,” understanding the randomness inherent to how many pucks go in on how many shots and recognizing when results are unsustainable will help you form more realistic expectations and also not freak out when a player on your team just isn’t getting the bounces. The stat itself couldn’t be simpler: you take the number of goals a player’s team scored when they were on the ice and divide that number by the number of shots that player’s team took while they on the ice. At 5v5, the average number is roughly 8%. 12% is extremely high while 4% is extremely low. Past results tell us that while there is player skill (and lack thereof) involved here, it’s mostly a matter of luck and the linemates you happen to play with. If you play with Stamkos and Kucherov, you’re probably going to have a nice oiSh%. If you play with Lucic and Jankowski, probably not.
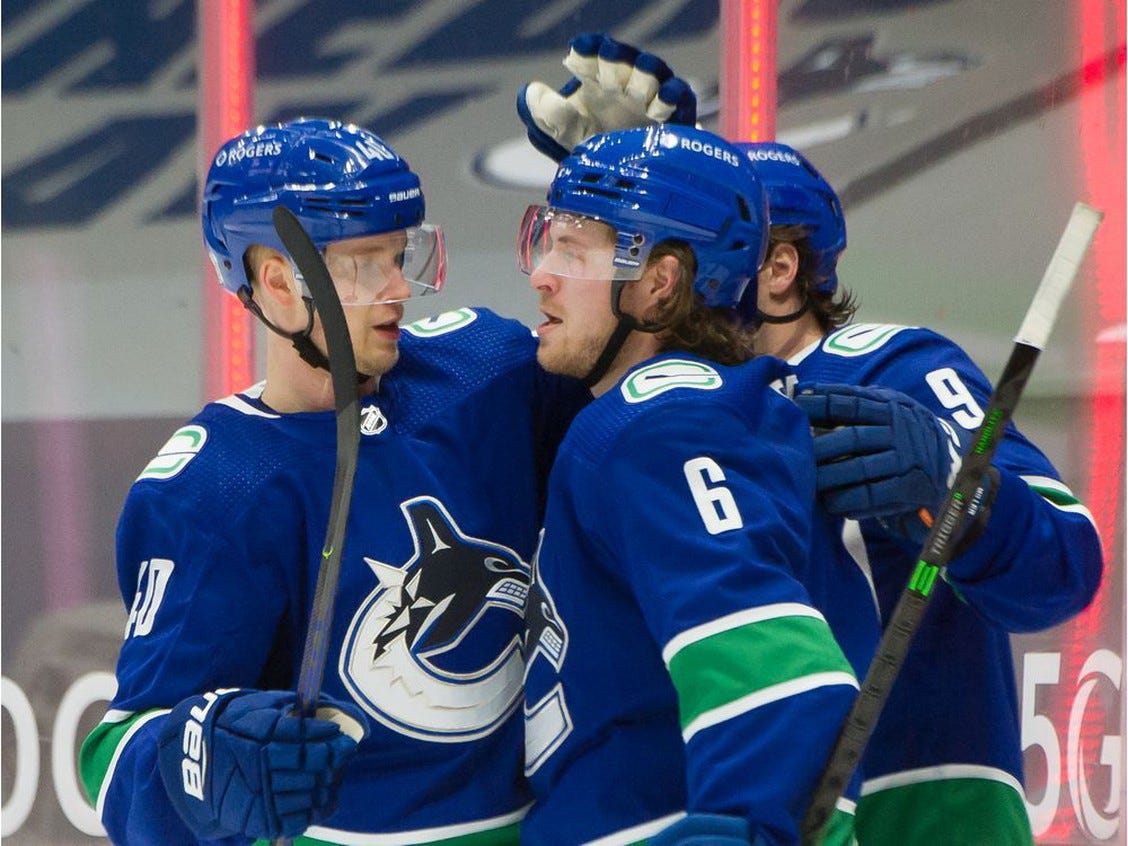
So let’s get to the point: Elias Pettersson has not been very good so far this season. That he has only 7 points in 11 games is the least of his problems; his underlying numbers have been abysmal as he’s gotten caved in on an almost nightly basis. For a guy who was one the league’s top players analytically last season, it’s been a really tough start. But he has also been arguably the luckiest player in the league when it comes to puck luck. Check this out:
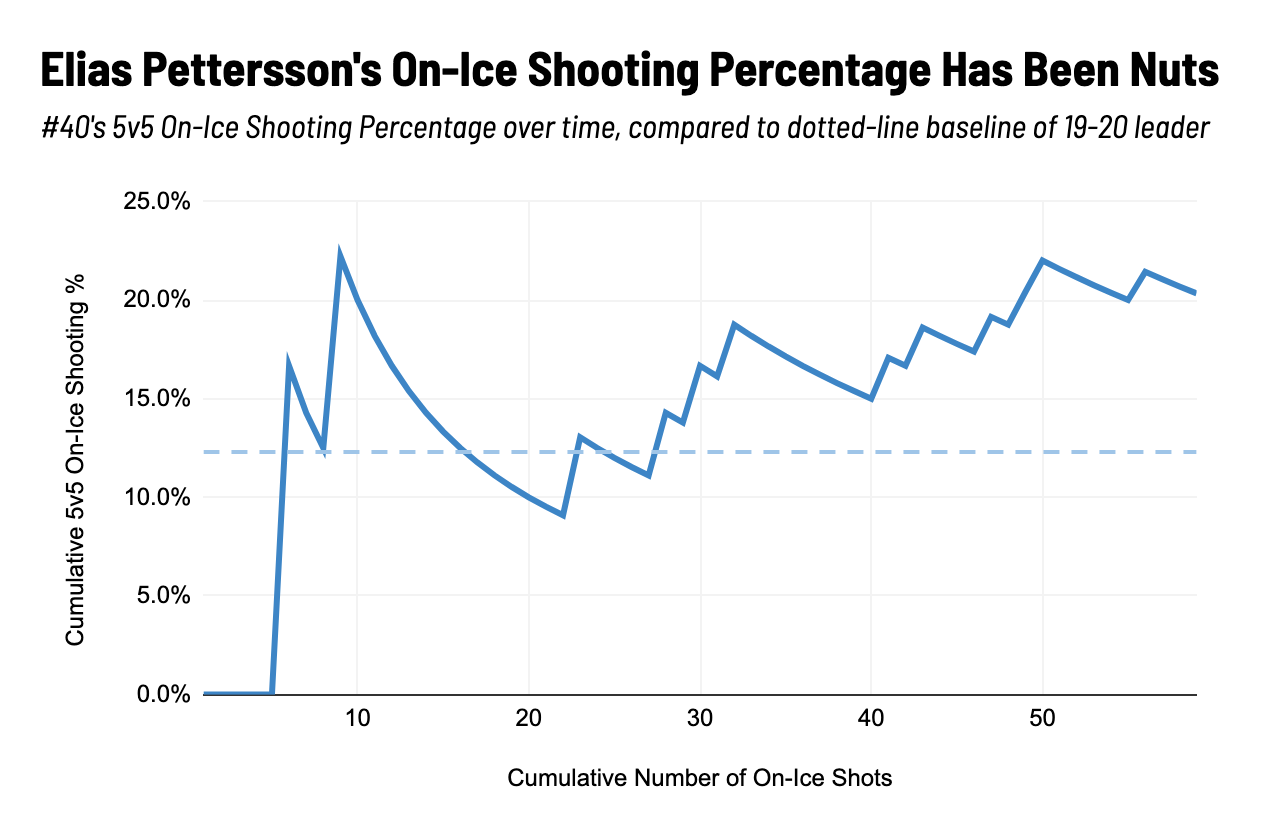
This graph shows Pettersson’s 5v5 on-ice shooting percentage over time where “time” is measured by the total number of shots he’s been on the ice for. The solid blue line shows his oiSh% at any given point of time. The dotted blue line is constant at 12.3% - that’s the highest oiSh% that any player with over 500 minutes played had last season (Brayden Point).
What that graph illustrates is not only how much higher Pettersson’s number is so far than even the most extreme result last season, but also that it keeps going up! That’s been what’s got me so interested - at every point when you would expect it to finally regress, it just keeps rising!
Here’s the same graph but with one more line added. The green dotted shows his expected shooting percentage as well.

It’s hovered around the low 6%-7% range throughout the season, in large part because the Canucks’ chances have mostly been point shots when he’s on the ice this season:

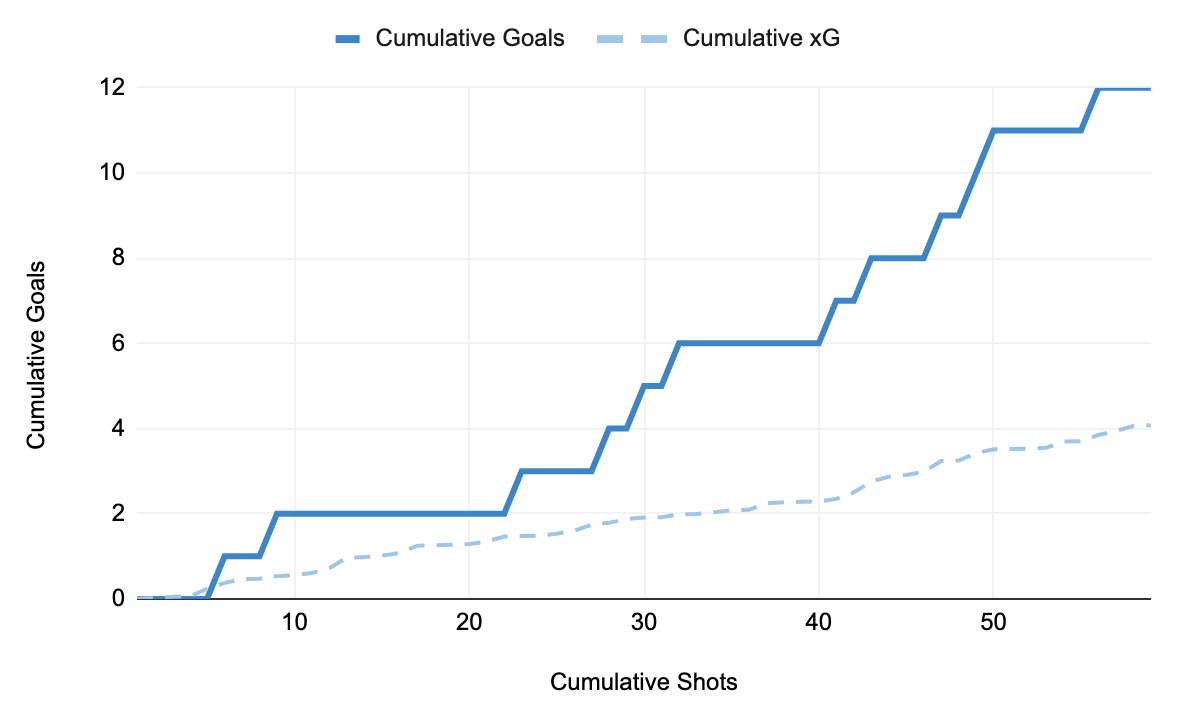
Let’s try one more. Again we’re using cumulative shots as our “timeline” here. The solid dark blue line is the number of 5v5 goals #40 has been on the ice for as the season as gone on and the dotted light blue line is the number of 5v5 expected goals he’s been on the ice for. As you can see it’s over three times as many now.
How is This Happening?
Elias Pettersson’s “baseline” oiSh% is pretty high based on his career results. It was 9.9% in 2018-19 and 11.8 in 2019-20, a rare level of repeatability for a number that high. This is in large part because while Pettersson has a very accurate shot, he doesn’t use it very much; among the 153 players in the league with over 10 goals last season, he ranked 143rd in terms of his personal share of his on-ice shots (he only took 18% of them). His passing talent could also have a significant effect on getting goalies out of position and making shots easier for his linemates, and it doesn’t hurt that he also tends to play with talented players with strong shots like J.T. Miller and Brock Boeser. With all that in mind, you’d expect high efficiency.
But I’m not sure that adds up this year. The first sign is that he actually hasn’t been an active part in creating those goals. He has a point on only six out of 12 goals he’s been on the ice for at 5v5 (50%), and a primary point on four out of 12 (33%). That’s a much lower participation rate than Boeser (78%) or Miller (71%). I think it’s far more likely that this is a product mostly of a Brock Boeser shooting bender (41% so far) than that Pettersson is in the driver’s seat here. It also doesn’t hurt that the Canucks were fortunate enough to play three straight against the Senators and Matt Murray.
As fun as it is to speculate that this will never stop rising (🚀🚀🚀) a crash is coming. The Canucks and Pettersson had better hope that the underlying numbers get back to where they need to be because otherwise things could get really ugly. As underwhelming as #40’s point totals have been this year, it’s only a glimpse at how poor of an impact he’s had on his team this year. He’s the franchise. The Canucks don’t have the depth to absorb a down-season. If you own Pettersson on-ice shooting futures, now’s probably the time to sell, sell, sell.
Hold the line!